Energy Institute


Do we pay a lot for our gas? Compared to the rest of Europe? And globally?

There are three main gas markets in the world: Europe, the USA, and North Asia (Japan, South Korea and Taiwan).

European consumers pay less than Japanese consumers pay for their gas and much more than consumers in the United States 1. The price gap between these three markets has grown since 2010 but this gap, though wide, has begun to narrow since 2013 (Fig. 5).


Figure 5. UK gas prices (NBP) in comparison to global gas prices

BP Statistical Review World Energy (accessed 2016). Natural gas Prices. Available online at: http://www.bp.com/en/global/corporate/energy-economics/statistical-review-of-world-energy/natural-gas-review-by-energy-type/natural-gas-prices.html

  • Japan
  • Germany
  • UK (and Ireland)
  • US
  • Crude oil


There are startling differences in the regional prices of gas in the period 2010 to July 2014. Henry Hub prices in the USA were very low in comparison with Europe. The rapidly developing Liquefied Natural Gas (LNG) trade brought new supplies to Europe and the softening of oil prices at the end of 2014 brought about a convergence.

We in Ireland pay at least the UK wholesale market price, an exit charge from the UK system plus the entry cost to the Irish transmission system at Moffat in Scotland. The additional costs that arise for consumers in the UK and in Ireland are those to pay for the national gas transmission and distribution systems. The final price we pay includes a supplier margin that is determined by competition between gas suppliers.

Thus, as consumers we have an interest in the regulation of the gas market, the level of investment in infrastructure allowed by the CER, and the assurance that supplier competition is real and effective.

Finally, because most gas imported into Ireland is used for electricity generation we have an interest in how Irish energy policy affects the demand for gas in electricity. As the demand for gas for electricity falls the cost of the existing infrastructure is carried by a lesser amount of gas and the unit cost of delivered gas has to rise.

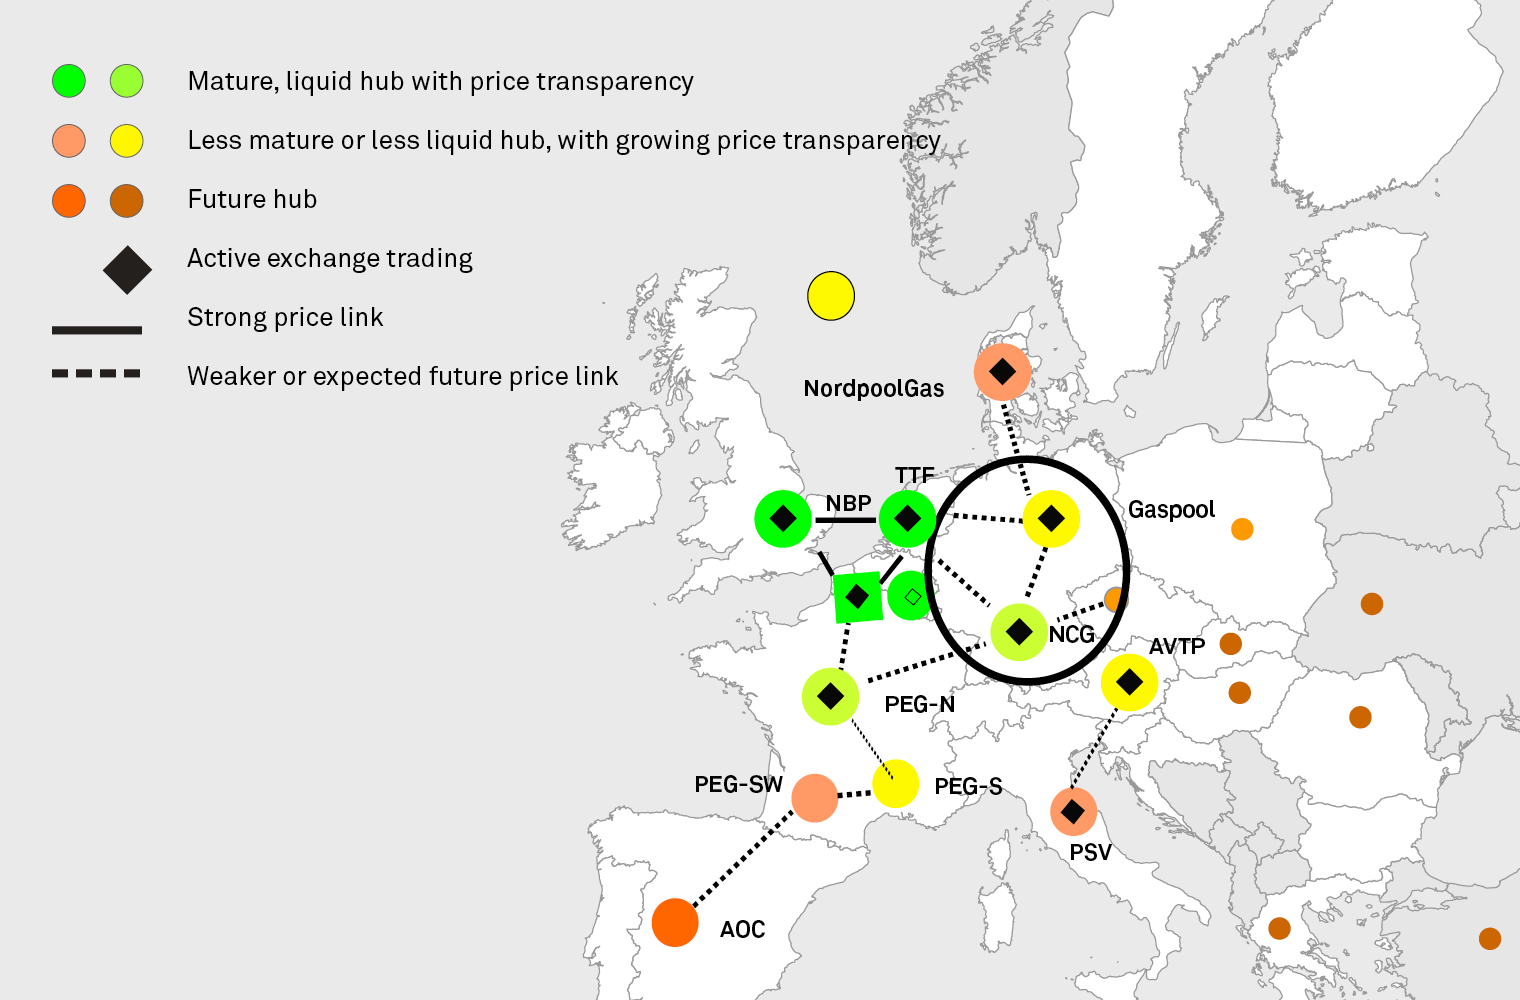
There are gas-trading points and trading hubs in Europe; the most important of these are the Dutch TTF (Title Transfer Facility), the National Balancing Point (NBP) in the UK and the German hubs (Fig. 6). Until Corrib came on stream we imported up to 96% of our gas from the UK and our prices are closely coupled to the UK NBP price.

With the growing use of natural gas in the 1960’s and onwards, in many cases it was in the producer country’s interest for gas prices to be referenced to oil prices. This was certainly the case for Russian gas where, until 2011, German BAFA prices closely followed an oil-linked formula. After a short transition BAFA prices in 2013 moved closer to the Dutch TTF, at which Dutch and Norwegian imports are priced. The EU favours the further development of gas trading hubs in Europe 2.


Figure 6. Map of hubs in Europe

European Federation of Energy Traders (2014) European Gas Hub Development. Available Online


The EU’s gas target model (GTM) is a structural framework that sets out how a functioning European gas market should emerge. It advocates market rules that enable the European regional and national gas markets to integrate and advance in terms of competition, sustainability and security of supply 3. According to a study by Frontier Economics for the Association of European Gas Regulators, only the UK meets all GTM1 criteria, with the Netherlands and Belgium close to meeting all criteria 4.

Ireland, being closely coupled to Great Britain, enjoys a measure of the benefits of the British gas market at the extra cost of shipping gas through the interconnectors to Ireland (Fig. 8, Fig. 9). Gas markets like Ireland may be too small to have an independent wholesale market in gas.  While we have the Irish Balancing Point (gas market) it currently does not have much liquidity but this may change.


Figure 8. Natural Gas Prices for Household Consumers at the beginning of 2015 in Euro/kWh

http://ec.europa.eu/eurostat/statistics-explained/index.php/File:Natural_gas_prices_for_household_consumers_2015s1_(EUR_kWh).png

  • Basic price
  • VAT
  • Taxes and levies


Figure 9. Average national price in Euro for natural gas per GJ – without taxes5

Source

  • Ireland
  • United Kingdom
  • EU (27 Countries)


The UK gas market operates a virtual entry-paid gas trading market called the NBP. This trading market (hub) has matured extensively since its inception in the mid 1990’s. The NBP has evolved into one of the most liquid gas markets in Europe, and allows both UK and Irish gas suppliers to hedge their customer portfolio requirements across a wide range of trading instruments and duration ranging from within day gas use (to meet on-the-day changes) through to 3-5 years out (to forward hedge customer requirements) 6.

In Europe, the UK (NBP) and Netherlands dominate the volume of gas traded 7.

By way of illustrating the divergence in gas prices around the world, in 2003 prices in Europe were three times those in the USA and in Japan they were more than five times that of the USA. Japan imports its natural gas on oil indexed pricing contracts by LNG tanker from Indonesia, Australia and the Middle East. In adopting oil-indexed pricing Japan paid contract prices far higher than the underlying long run marginal cost to produce and transport the gas, especially from 2011 to 2014 when oil prices were high 8.

On the other hand, the USA is self-sufficient in gas and in some areas, where the gas pipeline infrastructure is underdeveloped and there is a dearth of export potential, there is a glut of natural gas and prices are very low 9 (see Fig. 5 above).

Europe sits in between with more than half (53% in 2012) of its gas coming from within the EU and Norway. The other big supplier is Russia accounting for over 25% in 2012. Imported liquified natural gas (LNG) accounted for about 13% and the balance of about 8% came from North Africa. Germany is about 40% dependent on Russian gas 10.