Energy Institute


How do our greenhouse gas emissions compare with other countries? How do our emissions from energy compare to other countries?

Ireland’s greenhouse gas emissions per capita are among the highest in Europe (Fig. 3) 1,2 but our electricity system has lower emissions than several other systems in the EU 3.


Figure 3. Total Greenhouse Gas Emissions per Capita including international aviation (excluded from GHG reduction obligations) and excluding land use change

Source

  • Tonnes CO2 equivalent per capita


Our high (per capita) greenhouse gas emissions are due firstly to the nature of our agriculture and secondly to its size relative to our economy. There are almost seven million head of cattle in Ireland 4 and our agricultural output per head of population is much greater than in Britain, Germany or the Netherlands.

Energy related emissions accounted for two thirds of Ireland’s greenhouse gas emissions in 2013 and 2014 5.

The Agriculture sector is the country’s single largest contributor to greenhouse gases, accounting for 33.3% of the total (Fig. 4). Other large emitting sectors are Energy in Transport (19.5%) and Power Generation and Refining (19.1%), while Industry and Commerce account for a 15.5% share of emissions. Residential and waste management make up 9.8% and 2.7% respectively 6. Our emissions per capita in the transport and residential sectors are out of line with EU practice and will require strong action.


Figure 4a. Greenhouse Gas Emissions by NACE Sector, Ireland 2013

Eurostat (2016). Greenhouse gas emissions by economic activity. Available online.

  • Agriculture forestry and fishing
  • Mining and quarrying
  • Manufacturing
  • Electricity gas steam and air conditioning supply
  • Transportation and storage
  • Other services water supply and construction
  • Households


Figure 4b. Greenhouse Gas Emissions by NACE Sector, EU-28 2013

  • Agriculture forestry and fishing
  • Mining and quarrying
  • Manufacturing
  • Electricity gas steam and air conditioning supply
  • Transportation and storage
  • Other services water supply and construction
  • Households


A recent review by the European Environment Agency concluded that Ireland may not meet its EU greenhouse gas emissions reduction targets even if all the measures currently planned by the Irish Government to reduce carbon and other emissions are introduced and interim targets are met 9.

The EPA says that “we must invest in structural and behavioural change to enable the transition to a carbon-neutral and climate-resilient Ireland. These changes include the rapid decarbonisation of energy and transport and the adoption of sustainable food production, management and consumption systems” 10.

The country’s total emissions did fall throughout the 2008 and 2009 recession but with economic recovery came a rise in 2012. However, some indicators are positive. Our greenhouse gas emissions per unit (kWh) of electricity supplied have fallen nearly 50% since 1990; from 896 g CO2/kWh in 1990 to 456 g CO2/kWh in 2014. This figure excludes generators’ own use of electricity and transmission and distribution losses.

If we calculate the emissions from public electricity and heat production related to electricity production and the resulting electricity and heat production (generation), Ireland is slightly higher than the EU average, but still below several other countries (Fig. 5).

Emissions from fossil-fuel-generated power are higher still in other countries in the world (Fig. 6).
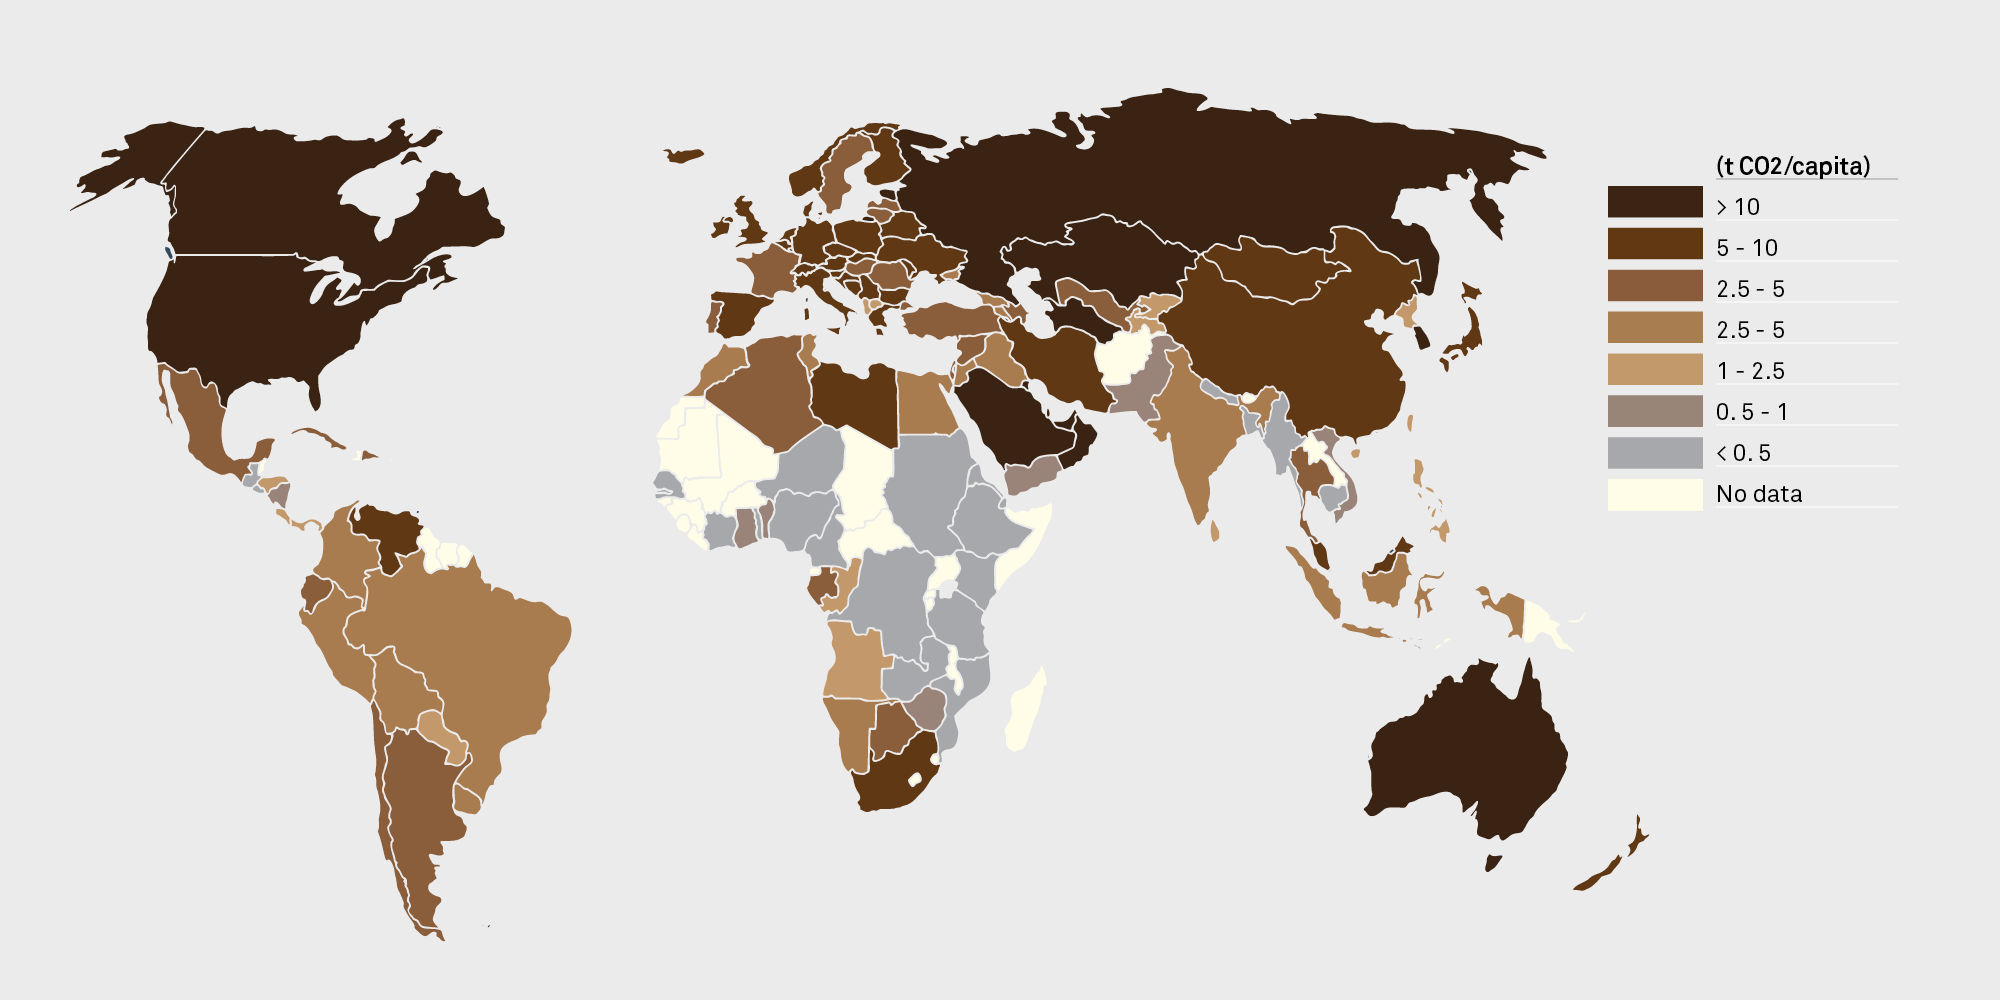

Figure 5. EU 15 emissions intensity in electricity generation (g CO2/kWh)

Eurostat (2016). Available Online.

  • g CO2/kWh 2013


Figure 6. Global CO2 emissions per capita from fuel combustion in 2013

International Energy Agency (2016). Energy Atlas. Available Online.